Portfolio and Account Values
On this page, we explain how to view your portfolio and account values and what the different account values mean.
Login
- Open your browser and visit the LYNX+ website
- Enter your username and your password
- Authenticate yourself via two-factor authentication
The further below explained values can be also found in the Trader Workstation and the LYNX Trading App. Please find further instructions for these platforms in the FAQ section.
Portfolio Overview
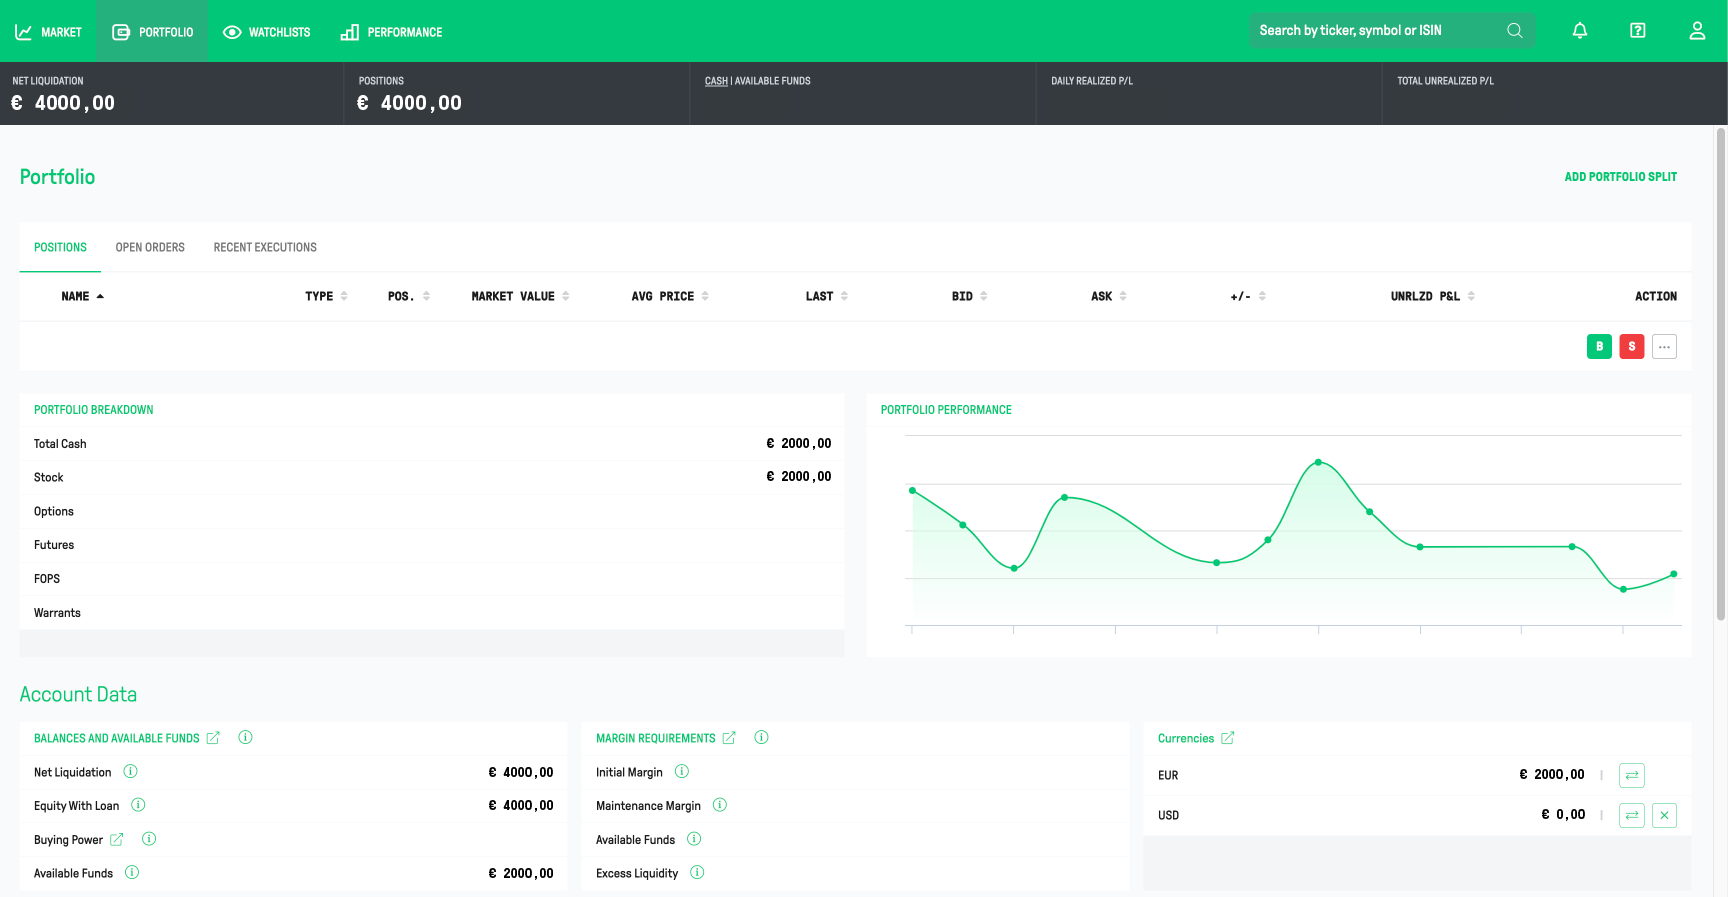
You can find your Portfolio tab in LYNX+ in the top left corner. When clicking on it, you will see a summary of your Open Positions. The size of the position, its current price and a brief profit & loss summary are displayed here.
You can navigate between different tabs to view your Open Orders and Recent Executions.

The Portfolio Breakdown view shows the value in your base currency of your positions by product category. The Portfolio Performance Chart shows the performance of the portfolio over the last two weeks. You can click on the Performance tab at the top of the page for more details about your trading results.
Please find the information about where to find the portfolio and account values in TWS and LYNX Trading App in the FAQ sections: “Where can I view my portfolio and account values in TWS?” and “Where can I view my portfolio and account values in the LYNX Trading App?“.
Balances and Available Funds
- Net Liquidation: Displays the total value of your trading account. This refers to your total cash value + the value of your stocks + the value of your options + the result of your futures trading.
- Equity With Loan: Refers to the available funds to cover margin requirements. If this value falls below EUR 2,000 in a margin account, the account will begin to function as a cash account. In the case of a cash account, this value represents settled cash.
- Buying Power: The theoretical total value of securities that you can buy, using depositing additional money with maximum leverage. For a cash account, this is equal to your available funds.
- Available Funds: Shows your spending power. This is the maximum amount for which you can still open new positions at that time. It is calculated as follows: Net Liquidation Value- Initial Margin.
Margin Requirements
- Initial Margin: The margin that has been required to enter into the positions you hold.
- Maintenance Margin: The margin required to retain your current positions and carry them over to the next trading day(s).
- Available Funds: Displays the maximum amount of funds available to open new positions. It is calculated as follows: Net Liquidation Value – Initial Margin.
- Excess Liquidity: The maximum value by which your portfolio can decrease before positions are automatically liquidated. It is calculated as follows: Net Liquidation Value – Maintenance Margin. More information can be found here.
Currencies
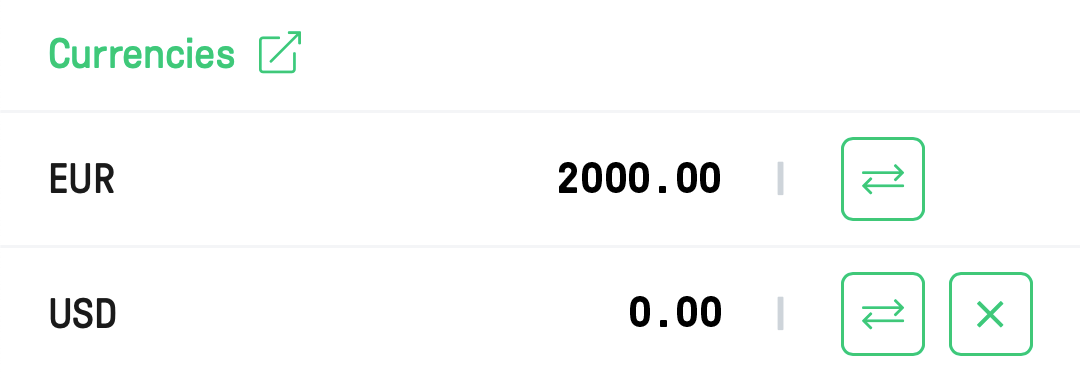
In the Currencies section, you can view your current cash positions, categorized by each currency in your account.
You can conveniently convert your different cash positions to another currency by clicking the Convert button. It is also possible to close a specific currency position and convert it to the base currency of your trading account by clicking the X button.

Please note that for trading in foreign products in a currency you don’t hold with a cash account, a corresponding currency exchange is first necessary.
With a margin account, it is possible to buy assets in advance without owning that specific currency. Please note that you will be paying debit interest for maintaining negative cash positions. For more information on this, click here.
Cash Movements
At the bottom of the Portfolio page, you will find all Cash Movements in your account for the selected period.
Under Cash Balance, you will find an overview of all inflows and outflows from your account, while you will also see the start and end balance for the selected period. You can easily change this period by using the various options above these columns.
The next column shows a detailed overview of all Inflow for the same period. While trading, the total turnover from sales of positions is displayed here. Here you will also find your dividends and credit interest, as well as the deposits made into your account. Clicking on the arrow next to a specific category, allows you to see further details of that specific category of inflow.
In the Outflow column, you will see the total amount paid for purchases. Commissions are shown as another category under outflows. Other charges, such as subscription fees for real-time data, are displayed here. Depending on when you paid debit interest in the selected period, debit interest may also appear as outflow. The same applies to your FX conversion loss (when this is profit, it is shown under income).
FAQ
You can view all the important values of your account in TWS. You do this by clicking on the Account button. If the button isn’t shown, click on Account on the top bar and select Account Window.
After this, a new window opens where your account data are divided into several tables.
You can find the explanation for the Account Values in the article above.
You can view your Portfolio information and its values by clicking on the Portfolio icon in the bottom ribbon of your app.
In the Portfolio section select Balances and here you will find detailed information about current values.
You will receive a warning from our partner when your available liquidities are less than 10%. This is an automatic mail, so a sudden/temporary drop will cause this to be sent as well.
When your available liquidity drops below 5% of the total value of your portfolio, you can see this reflected by your Net Liquidation Value being highlighted in orange. Apart from this, you can also see it by the orange warning symbol. This is visible on every page within LYNX+. In addition, in the Portfolio screen, your available liquidities are also shown in orange.
When your available liquidities drop below 0% of the total value of your portfolio, you can see this reflected by your Net Liquidation Value being highlighted in red. Alongside this, you can also see a red warning symbol. This is visible on every page within LYNX+, but in addition, on the Portfolio screen your available liquidity is also shown in red.
If you wish to free up more available liquidity to protect yourself from further future declines, there are several actions you can take:
- You can transfer funds to your trading account. To do this, you can use the deposit instructions.
- You can execute an order that lowers your current margin requirements. In most cases this means you can close or reduce a current open position. You can perform an internal transfer from other accounts linked to your securities account
- In TWS you can right-click on a position in your portfolio and subsequently select the “Set Liquidate Last” parameter. If you can’t see this parameter, you can look it up via the search bar on top of the pop-up menu.
If possible, the system will try to protect these positions when a liquidation occurs on your account. However, there is no guarantee that these position(s) will also effectively not be liquidated earlier by the system.
Go to the Portfolio tab and select the currency you want to convert under Currencies. For more information on how to convert currencies, click here.
It’s important to understand how the FIFO (First In, First Out) methodology determines the average price of your securities. FIFO is a widely used accounting method that impacts how the cost basis of your trades is calculated, particularly when you buy and sell the same security multiple times.
What is FIFO?
FIFO assumes that when you sell securities, the oldest shares (the ones you bought first) are sold first. This approach affects the cost basis of the shares you sell and the average price of the shares you still own.
The average price of your remaining position is recalculated after every transaction to reflect the updated total cost and quantity of your holdings.
Scenario:
- You buy 100 shares of Stock XYZ at $50 per share.
- Later, you buy an additional 50 shares of Stock XYZ at $60 per share.
- Finally, you sell 80 shares of Stock XYZ at $80 per share.
After both buy orders, your average price of the 150 shares is $53,33.
Imagine the current price of your shares are $80 per share and you decide to sell 80 shares, FIFO assumes the first 100 shares purchased at $50 are sold first for this sell order. Which makes a profit of $30 per share.
After the sell order, to calculate the new average price of your shares, the system calculates the total cost price once again. From your initial first purchase there are still 20 shares left that were bought for $50 each, plus the 50 shares that were bought for $60 makes a total of $4000. $4000 divided by the amount of shares (70) makes a new average price of $57,14.
The average price is calculated by dividing your cost (execution price + commission + taxes if applicable) by the quantity of your position. This value is then used to determine your unrealized P&L.
Summarized:
Old situation (before sell)
Amount of Shares = 150
Old Average price = $53,33
Current price = $80,00
Unrealized Profit/Loss = ($80-$53,33) * (150 shares) = $4000,50
New situation (after sell)
Amount of Shares = 70
Current price = $80,00
New Average price = $57,14
Unrealized Profit/Loss = 70 * ($80 – $57,14) = $1600,50 profit.
Realized Profit/Loss = $30 profit per share * 80 = $2400 (excluding costs)
So what’s important to take in account, after the transaction your unrealized profit per share will change, but this change has turned into realized profit or loss within the shares that has been sold.
